Unsurprisingly, we found games that received featured placement during the 11 days of this year's Steam Summer Sale generally saw a sizable increase in sales compared to the pre-sale period. However, it was a bit of a shocker that larger discounts didn't always correlate with larger sales increases, and the reduced sale prices often meant games brought in seemingly less overall revenue during the sale period.
What do we mean by "sale"?
To start, we should clarify what games we're looking at specifically when we talk about games "featured" in the Steam Summer Sale. After all, practically every developer on Steam these days tries to jump on the sale bandwagon with some sort of self-imposed discount during the event. According to price trackers, nearly 4,400 of the over 5,700 games listed on Steam saw a price reduction during the 11 days of this year's sale (June 11 through 21).With the vast majority of those games, though, you'd only notice the discount if you were specifically looking for that game through a search, wishlist notification, or some other deep browsing of Steam's catalog. For most casual consumers, the Steam Summer Sale instead begins and ends with the discounts featured on the front page of the store: the 300 or so games that were promoted as part of the regular Daily Deals, Flash Deals, and Monster Deals. These are the titles that were presented front and center when users logged in to the Steam store during the Summer Sale, and they tended to get covered widely in sometimes breathless press coverage and forum threads.
It's these "featured" games that we're most interested in for this analysis. Steam Spy took a wider look in its own excellent Summer Sale analysis, examining at the entire universe of discounted games during the sale. That analysis found most of these non-featured games didn't move the sales needle much at all with their discounts; at least 76 percent of all discounted games failed to sell more than 5,000 copies during the sale period.
So in a vast sea of discounted games, it seems that only a relative handful garnered the majority of actual consumer interest. As you'll see, our own data suggests it was the front-page "featured" games that were the most likely to see a big sales bump from the Summer Sale.
-
Top performing featured games during the 2015 Steam Summer Sale:
#1: DeadCore: 75% off on Day 2 Monster sale—153.9 percentage point relative sales improvement -
Top performing featured games during the 2015 Steam Summer Sale:
#2: Micreated: 60% off on Day 2 Flash sale—92 percentage point relative sales improvement -
Top performing featured games during the 2015 Steam Summer Sale:
#3: Titan Souls: 40% off on Day 8 Flash sale—84.7 percentage point relative sales improvement -
Top performing featured games during the 2015 Steam Summer Sale:
#4: Ori and the Blind Forest: 40% off on Day 8 Daily Deal—81 percentage point relative sales improvement -
Top performing featured games during the 2015 Steam Summer Sale:
#5: Primal Carnage: Extinction: 50% off on Day 8 Monster sale—77.7 percentage point relative sales improvement -
Top performing featured games during the 2015 Steam Summer Sale:
#6: Hyperdimension Neptunia Re;Birth1: 70% off on Day 5 Daily Deal—76.8 percentage point relative sales improvement -
Top performing featured games during the 2015 Steam Summer Sale:
#7: Grim Fandango Remastered: 50% off on Day 4 Daily Deal—71.7 percentage point relative sales improvement -
Top performing featured games during the 2015 Steam Summer Sale:
#8: Creeper World 3: Arc Eternal: 90% off on Day 2 Monster sale—68.9 percentage point relative sales improvement -
Top performing featured games during the 2015 Steam Summer Sale:
#9: Grow Home: 50% off on Day 2 Flash sale—66.5 percentage point relative sales improvement -
Top performing featured games during the 2015 Steam Summer Sale:
#10: Grey Goo: 60% off on Day 2 Daily Deal—65.5 percentage point relative sales improvement. See the last page of this report for a full list
Methodology
Because of its rolling three-day sampling method, Steam Gauge data can be pretty noisy, bouncing up and down a bit from one day to the next. To minimize problems caused by that day-to-day noise and to create an apples to apples comparison for games that were featured on different days, we defined a two week "sale period" from June 10 (the day before the sale started) to June 24 (when the rolling sample had fully caught the last day of the sale). We also defined a similar two-week "pre-sale" period from May 27 through June 10 to act as a "baseline" sales reading for each game. This is important to separate out games that are selling well because of the Summer Sale from games that happened to be selling well already.
For both the pre-sale and the sale period, we looked at the relative percentage change in total estimated owners over the two weeks; a game that went from 50,000 to 60,000 owners was treated as the same 20% increase as one that went from 500,000 to 600,000 owners. Looking at percentage changes like this is often more useful than looking at raw sales numbers when comparing across games, because games with a lot of owners already tend to have a self-sustaining momentum that drives further sales increases. A top-selling game like Left 4 Dead 2, for instance, gets more new owners in a typical month than most Steam games get in their entire lifetimes.
To limit sometimes wild percentage swings in relatively unpopular games (which are the most likely to see sampling-based jumpiness as well), we disregarded games that started the pre-sale period with under 20,000 estimated owners from our analysis. This left us with just over 2,600 total games to look at. Of that total, 284 were featured in a Daily, Flash, or Monster Deal during the Steam Summer Sale.
Results
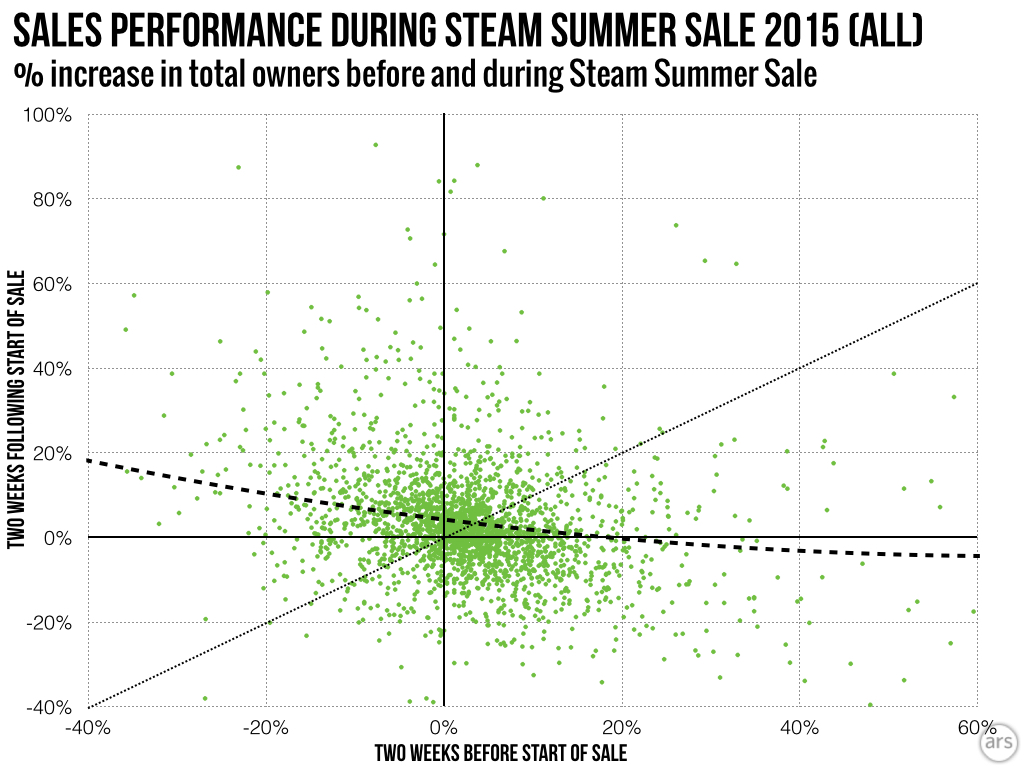
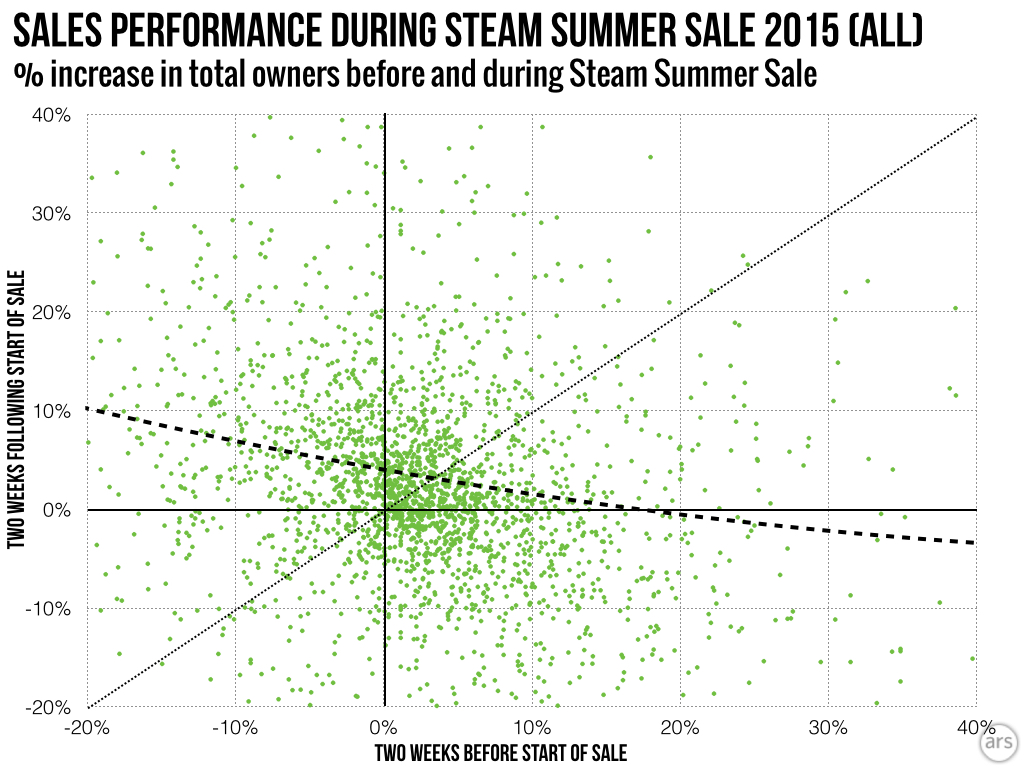
First, let's look at how the wider universe of Steam Games did during the Steam Summer Sale. The scatterplot above looks at all 2,600+ games in our analysis, showing the percentage increase in total owners during the pre-sale period on the X axis and during the sale period on the Y axis. It's the relative performance that's important here; the dots above and left of that diagonal dotted line sold better during the sale than before, while those below and to the right did relatively worse during the sale (note that a few extreme outlier points do not show up in this and subsequent charts to allow for a tighter, more legible range).
It's hard to make out much of a pattern in the scattershot of tiny points spread out across the graph, but the polynomial best-fit curve (the thick dotted line in the chart) indicates a bit of a pattern. Games that were selling well before the sale generally did a bit worse during the sale, and games that were doing poorly before the sale generally did a bit better during the sale. However, there's a lot of variance at any point.
Right in the middle, a game that saw no growth before the sale could expect a marginal improvement of about 3 or 4 percent during the sale. Again, the vast majority of these games saw some sort of discount during the sale period, even if those discounts were never featured on the front page of the Steam store. A small average improvement isn't that unexpected.
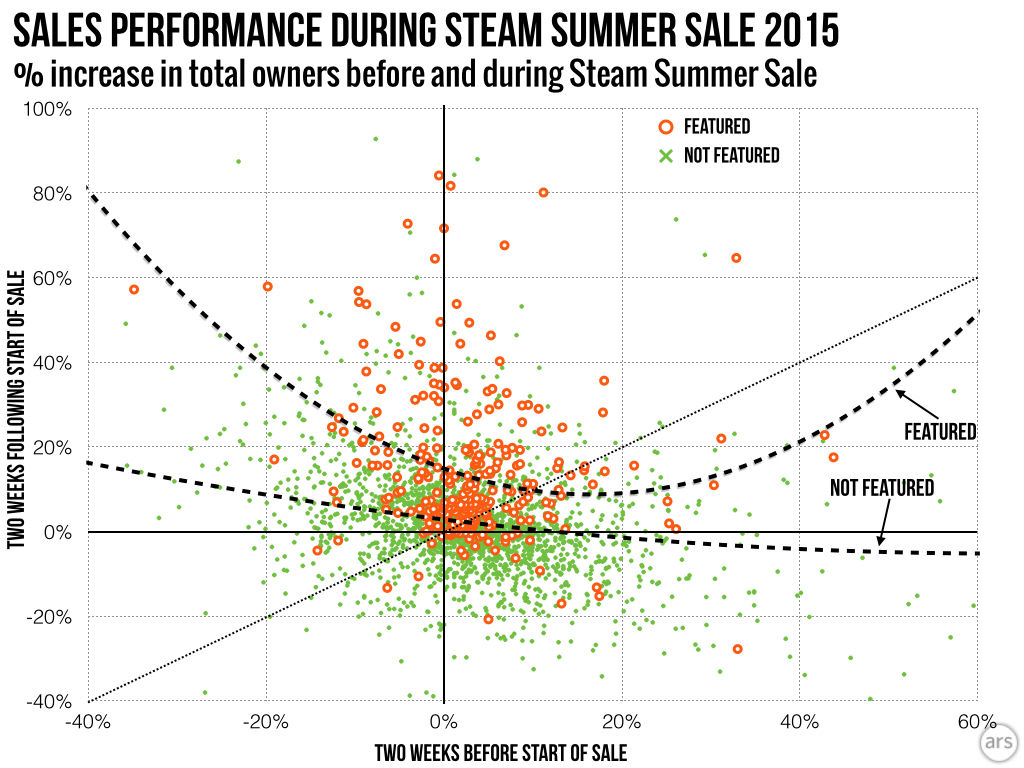
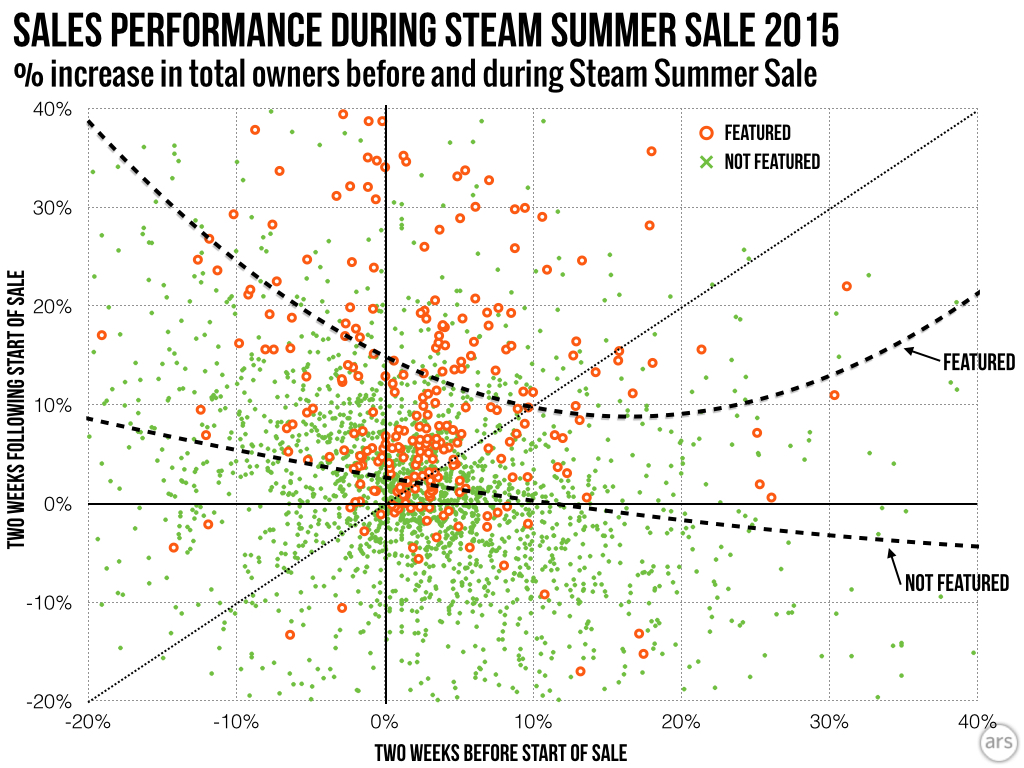
When you look break out games that were featured on the Steam front page, though, things look very different. Everything is skewed upwards, indicating a much better relative performance during the sales period than before it. The polynomial fit line similarly shows that most of these "featured" games end up on the positive side of that "break even" diagonal line; only games that were already doing really well tended to do relatively worse when featured during the sale.
reader comments
76