This is a guest blog written by Jeroen Smits of the Global Data Lab, an initiative hosted by the Nijmegen Center for Economics (NiCE) at Radboud University in the Netherlands.
Disaggregation of indicators at the subnational level is one of the key elements to effectively monitor the Sustainable Development Goals (SDGs). At the same time, this is a great challenge, as in the case for many countries, only indicators at the national level are available.
This is particularly the case for poor countries, where administrative systems are less equipped and capable to generate reliable and representative information. Strengthening those systems is the preferred solution, but that takes time and does not produce the indicators for earlier years required for tracing developments over time.
Generating subnational socioeconomic, health, and demographic development indicators from household surveys
A newly developed alternative is to generate subnational indicators on the basis of available household survey data. In the last few decades, over 600 large representative household surveys have been conducted in low and middle income countries.
1 These surveys contain a wealth of socioeconomic, health, and demographic information at the individual and household level that can be used to create indicators for a country’s subnational areas (provinces, states, prefectures, and the like).
The Global Data Lab (GDL, www.globaldatalab.org) uses this technique to create sub-national development indicators that are free to use, re-use, and redistributed by anyone. The procedure is straightforward. For example, the educational level of an area is created by taking the mean years of education of individuals in a certain age group. The same area’s vaccination coverage is computed as the percentage of children aged one who received a specific vaccination.
Global Data Lab Area Database
Called the GDL Area Database, it currently contains 77 indicators for 1024 subnational regions in 103 low and middle income countries. For most countries, data for several years are provided so that changes can be monitored over time.Indicators are available for education, fertility, wealth and poverty, asset ownership, population shares, demographic window of opportunity, child mortality, vaccinations, housing characteristics, public services, and children’s stunting and wasting.
We are continuously updating and adding to this database.
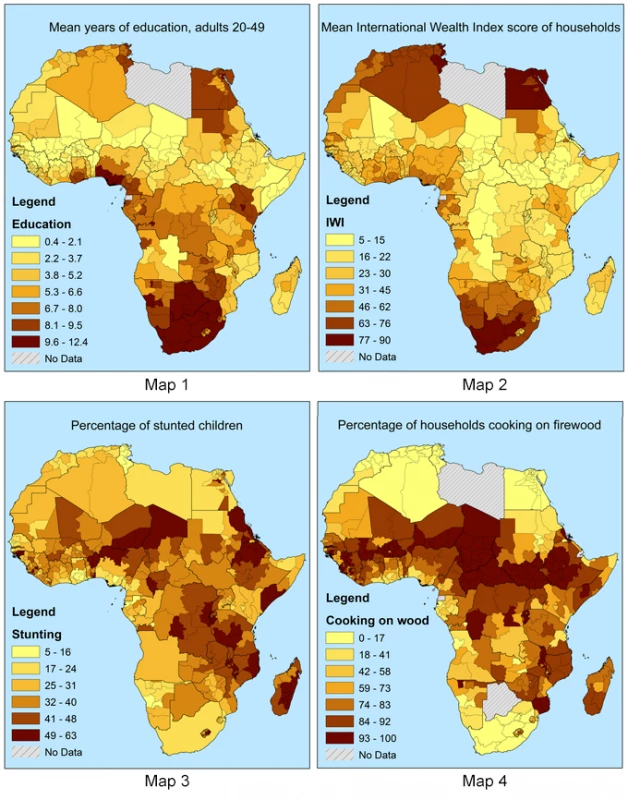
To help illustrate the variety of indicators available, above you can see four maps featuring indicators on education, wealth, stunting of children and cooking on firewood.
Map 1
Map 1 displays mean years of education for 430 areas in 50 African countries. We observe the well-known differences among African regions, with low levels in the Sahel region and higher levels in the north east, south, Kenya, and the oil-rich coastal areas near the Gulf of Guinea. We also see that within most of the countries, clear differences among regions exist, which emphasize the importance of subnational data.Map 2
Data on income and poverty at the subnational level is difficult to obtain for African countries. So we use the International Wealth Index (IWI), an asset index based on possession of durables (televisions, refrigerators, cars) and housing characteristics. 2 IWI is the first wealth index that is comparable across time and place. At the national level, IWI is highly correlated with GNP per capita and the Human Development Index. Map 2 shows subnational values of IWI for 50 countries. The pattern largely mirrors the educational picture, with higher levels of development in the north, south, and mid-western coastal areas, and substantial differences within the countries.Map 3
Stunting, a condition caused by chronic malnutrition which slows down a child’s growth, affects some 162 million children under five, many of whom live in Africa. It is associated with increased mortality and has long-term effects on cognitive and psychosocial development, school performance, and economic productivity. 3 The World Health Organization has made its number one Global Target to reduce stunting in children under five by 40% by 2025. Map 3 shows subnational stunting rates of children under five for 390 areas in 44 countries, plus national figures for five countries. Stunting rates are particularly high in Ethiopia and in the Central-African zone running from Madagascar to Niger and Chad. The countries show clear subnational variation.Map 4
Map 4 shows that many households in Africa still use firewood and other harmful biomass fuels for cooking. Indoor smoke from solid fuels continues to be a major cause of avoidable deaths and illness. 4 Women are particularly affected, as they spend most of their time working near the fire and in smoky kitchens. The use of biomass is also associated with deforestation, environmental degradation, and global warming.The maps aim to provide a first impression of the possibilities offered by the GDL Area Database. These and many other indicators are available for several years between 1990 and 2015. We also have indicators for Latin American and Asian countries.
Flexible technique
Aggregation from survey data is a flexible technique that can be used to create subnational indicators for any topic that is covered in household surveys. And the available surveys include data on many more topics than the ones mentioned here. With the infrastructure developed at GDL, we also can aggregate to other levels, like wealth quartiles or educational categories, as well as create combinations of indicators for specific issues, like stunting levels by birth order or contraceptive use by age group.Please take a moment to visit the Global Data Lab website at www.globaldatalab.org , once again , an initiative hosted by the Nijmegen Center for Economics (NiCE) at Radboud University in the Netherlands. Also, please use the comment field below to share your feedback on the site.
Notes
1 Major data sources are Demographic and Health Surveys (DHS), World Bank Living Standard Measurement Surveys (LSMS), UNICEF Multiple Indicator Cluster Surveys (MICS) and census microdata of IPUMS-International.
2 Smits, J. & R. Steendijk (2015). The International Wealth Index (IWI). Social Indicators Research, 122(1), 65-85.
3 WHO (2014). Global Nutrition targets 2025: stunting policy brief (WHO/NMH/NHD/14.3). Geneva: World Health Organization.
4 WHO (2016). Household air pollution and health. WHO Fact Sheet no 292. Available at www.who.int/mediacentre/factsheets/fs292/en/

Join the Conversation