About
Dana Lyons' Tumblr
Charts, stats and other market musings from Dana Lyons, partner at J. Lyons Fund Management, Inc., RIA, editor of The Lyons Share and co-founder of My401kPro.com "Long-term investment growth through actively managed risk"
+ FOLLOW THIS TUMBLR
Another “Less Than Meets The Eye” Rally In The Nasdaq?

For the second Friday in a row, the Nasdaq put in a rally that, under the surface, was not as impressive as its headline gain would suggest. A week ago, we noted that the April 24 rally of more than 1.5% in the Nasdaq 100 (NDX) to a 52-week high was accompanied by A) both negative breadth and volume breadth on the exchange and B) a decline on the day in the Russell 2000 small cap index (RUT). As unhealthy as that sounds, upon inspection of days showing similar conditions historically, there did not appear to be any negative aftereffects, at least beyond some potential short-term weakness.
As it turns out, the short-term weakness did show up last week with stocks selling off the first 4 days of the week, culminating with a particularly weak session on Thursday. On Friday, the NDX was able to bounce back smartly, this time gaining nearly 1.5%. The bounce, as we mentioned however, occurred on relatively light participation across the exchange. The question is, does this weak bounce suggest anything more negative in terms of future performance than last week’s unimpressive rally?
First off, what accounts for the “relatively light participation”? Well, we took a look at some of the same metrics as the study from a week ago, i.e., the Russell 2000 and breadth. This is what struck us about Friday’s rally:
- While the NDX gained back 1.47% of the 1.65% it lost on Thursday, the number of advancing-declining issues (+546) on the Nasdaq exchange registered just 37% of the deficit it showed on Thursday’s decline (-1484).
- Similarly, despite the fact the NDX gained back nearly all of its losses from Thursday, the Russell 2000 gained back just 30% of its losses (+0.65% vs. -2.15%).
So you can understand why we would take issue with the level of participation in Friday’s NDX rally. Again though, does it matter? Well, like the study of a week ago, with all apologies to those looking for a reason to expect a significant correction, this doesn’t appear to be one.
First, here is the chart of median returns following NDX bounces on relatively weak advance-decline breadth (blue line) like we saw on Friday (115 occurences since 1991). For the sake of comparison, we also included 1) the median return following NDX bounces when breadth recovered the entire deficit that it experienced the previous day and 2) the median return following all days.

While returns tended to lag typical returns out to 1 month, it certainly was not a disaster. The worst one could say was that the median 2-week return was 0%. So perhaps there has been a tendency to underperform in the short-term. However, it has not historically been a longer-term warning.
Likewise, median returns following strong NDX bounces with weak Russell 2000 performance has not historically signaled much in the way of future weakness. In fact, not only have returns following such days (50 occurrences) been better than the median returns following all days, they have been significantly better than NDX bounces that occurred with strong Russell 2000 performance. The chart:
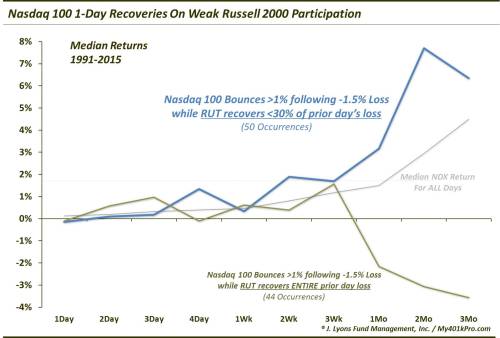
Surprisingly, NDX bounces with weak Russell 2000 participation showed a median 3-month gain of +6.3% versus a median loss of -3.6% following bounces with strong Russell 2000 performance. This is not the action we expected to see when we began to research these historical precedents.
Incidentally, lest you think (as we wondered) that perhaps the returns following such “weak” NDX rallies were any worse when the index was near a 52-week high, they were not. They were even better. Consider these statistics:
- 18 of the NDX bounces on relatively weak breadth occurred within 3% of a 52-week high (as did Friday’s). The median 1-week, 1-month and 3-month returns following were +1.5%, +2.9% and +11%, respectively.
- 11 of the NDX bounces on relatively weak Russell 2000 performance occurred within 3% of a 52-week high (as did Friday’s). The median 1-week, 1-month and 3-month returns following were +2.2%, +12.5% and +23.8%, respectively. 2 weeks following, 9 of the 11 occurrences were positive and by 2 months, 10 of the 11 were positive.
This study is a good reminder not to simply assume that a certain outcome is more likely given a set of circumstances, as sound as the assumption may seem. It was a bit of an eye-opener for us as we are staunch proponents of strong participation in rallies as evidence of a healthy market (though, our focus is more on the intermediate-term). As we have stated often, we have many concerns about this market in the longer-term. However, based on the historical facts, the Nasdaq rallies on relatively weak breadth and small cap participation the past 2 Fridays should not be one of them. Sure, there have been examples of these days that occurred near significant tops; however, the median returns following such rallies have been at least as good as any average day and in many cases, much better.
Thus, while there may be less than meets the eye to these Nasdaq rallies, there may also be less than meets the eye to the concerns based on them.
_____________
More from Dana Lyons, JLFMI and My401kPro.
The commentary included in this blog is provided for informational purposes only. It does not constitute a recommendation to invest in any specific investment product or service. Proper due diligence should be performed before investing in any investment vehicle. There is a risk of loss involved in all investments.
miamibizloans reblogged this from financecontributors-blog
philpearlman-blog liked this
twindog4 reblogged this from financecontributors-blog
financecontributors-blog reblogged this from jlfmi
 kingfisherinme-blog liked this
 jlfmi posted this